Boards
Boards
For ideas, processes, mindmaps, architecture, and kanban workflows. Best when the agent needs to organize information into nodes, flows, and stages.
“supplier onboarding flow”
“build me a project mindmap”
“turn these tasks into kanban”
Typical agent calls
create_boardupdate_boardexport_board_png
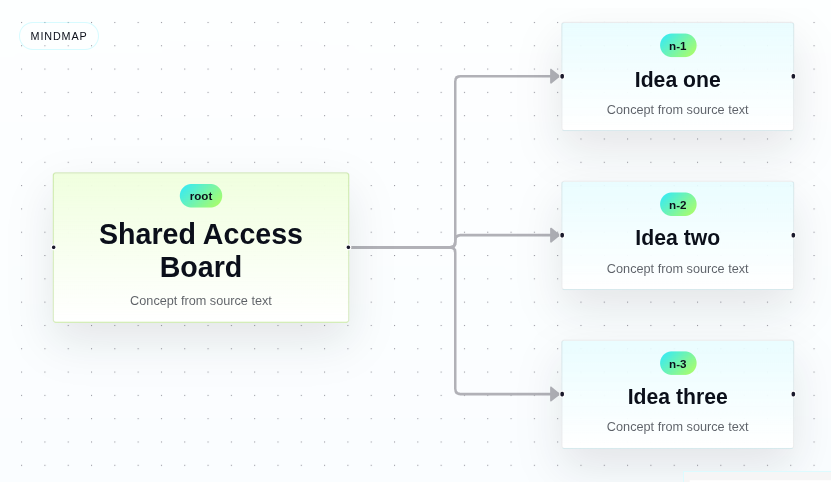
Board views
Mindmap